Introduction:
Safety performance has traditionally been monitored by ‘after the loss’ measures to assess outcomes such as accident and injury rates, incidents, and dollar costs. These are known as lagging indicators. For the last two decades there has been a growing recognition across various sectors that data from lagging indicators is limited. It comes too late to allow for preventative action
to be taken, and all too often offers little insight into how to prevent further losses.
Why measure safety performance?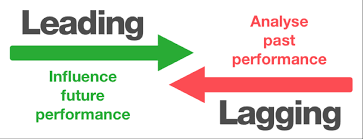
Safety Management System (SMS) standards and recommended practices promote the development and maintenance of means to verify the safety performance of your organization and to validate the effectiveness of safety risk controls.
The analysis and assessment of how your company ‘functions’ to deliver its activities should form the basis for defining your safety policy, the related safety objectives and the corresponding safety performance indicators and targets.
SMS requires a systemic approach as with any other element of business management (e.g., quality, finance), and in this respect safety performance measurement provides an element that is essential for management and effective control: 'feedback.'
-Feedback will allow management to validate the analysis and assessment of how well your organization functions in terms of safety and to make adjustments as required (Plan-Do-Check-Act).
-Feedback to your management will guide decision-making and resource allocation.
-Feedback to all staff will ensure that everyone is informed on your company’s safety achievements. This will help to create commitment and contribute to fostering your company’s safety culture.
Effective safety performance measurement will support the identification of opportunities for improvement not only related to safety, but also to efficiency and capacity.
The management of safety relies on the capabilities of your organization to systematically anticipate, monitor, and further develop your organizational performance to ensure safe outcomes of your activities. Effective safety management requires a thorough understanding and sound management of your system and processes. This cannot be achieved without some form of measurement. Rather than randomly selecting outcomes that are easy to measure, you should select safety performance indicators that consider the type of feedback needed to ensure your company’s capabilities for safety management can be properly evaluated and improved. This implies that you will need to measure performance at all levels of your organization by adopting a broad set of indicators involving key aspects of your system, and operations and allowing to measure those key aspects in different ways.
Key performance indicators (KPIs) are values that measure your organization’s success at meeting its objectives. KPIs provide insight into business conditions like:
- Predictability
- Early return on investment (ROI)
- Product quality
- And more
In practice, KPIs measure how a company will strategically grow.
However, behind every KPI is the implication that current conditions influence trends and inform predictions for future growth. Leading and lagging indicators are qualifiers that assess a business’s current state (lagging indicator) and predict future conditions (leading indicator).
Characteristics of good indicators:
For any performance indicator to be effective, it is important that it is:
a) Objective and easy to measure and collect,
b) Relevant to the organization or workgroup whose performance is being measured,
c) Providing immediate and reliable indications of the level of performance,
d) Cost efficient in terms of the equipment, personnel and additional technology required to gather the information,
e) Understood and owned by the workgroup whose performance is being measured.
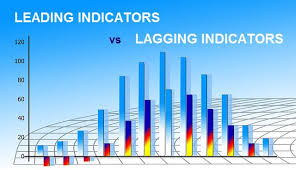
What are leading & lagging indicators?
Leading and lagging indicators help enterprise leaders understand business conditions and trends. They are metrics that inform managers that they are on track to meet their enterprise goals and objectives.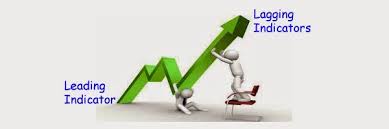
Lagging indicator
‘Metrics that measure safety events that have already occurred including those unwanted safety events you are trying to prevent’
Lagging indicators are typically “output” oriented. They are easy to measure but hard to improve or influence. A lagging indicator is one that usually follows an event. The importance of a lagging indicator is its ability to confirm that a pattern is occurring.
Lagging indicators are measures of safety occurrences, in particular the negative outcomes that the organization is aiming to prevent. Lagging indicators are mainly used for aggregate, long-term trending, either at a high level or for specific occurrence types or locations. Because they measure safety outcomes, they can be used to assess the effectiveness of safety measures, actions, or initiatives and are a way of validating the safety performance of the system. Also, trends in these indicators can be analyzed to determine if latent conditions exist in present systems that should be addressed.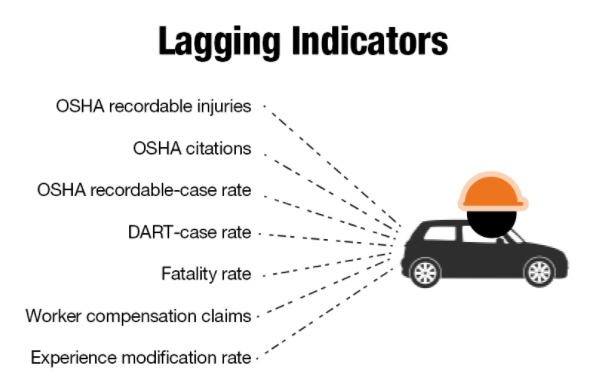
Two types of lagging indicators are generally defined as:
- Indicators for high severity negative outcomes, such as accidents or serious incidents.
The low frequency of high severity negative outcomes means that aggregation (e.g., at industry segment level or regional level) may produce more meaningful analyzes. - Indicators for lower level system failures and safety events that did not manifest themselves in serious incidents or accidents (including system failures and procedural deviations); however, safety analysis indicates there is the potential for them to lead to a serious incident or accident when combined with other safety events or conditions. Such indicators are sometimes referred to as ‘precursor event’ indicators.
Indicators for lower level system failures and safety events are primarily used to monitor specific safety issues and measure the effectiveness of safety controls or barriers put in place for mitigating the risk associated with these hazards.
Lagging indicators characteristically:
a. identify trends in past performance
b. assess outcomes and occurrences
c. have a long history of use, and so are an accepted standard
d. are relatively easy to identify and analyze
Examples of lagging indicators?
The number or location of OSHA recordable incidents; incident rates, including Total Recordable Incident Rate (TRIR), Days Away, Restricted, or Transferred (DART) Rate, and Lost Time Incident Rates (LTIR); are all examples of lagging indicators.
While it’s necessary to track lagging indicators, unfortunately, they provide little direction or insight into the behaviors and conditions that precede incidents. That’s why they should not be the only metrics that you examine. Lagging indicators are most useful when they are reviewed together with leading indicators.
How to use lagging indicators:
Lagging indicators are always triggered by an event that has just occurred, and, in that sense, are a little more self-explanatory than leading indicators.
If you’re measuring the outcome of an event, product release, sales training program or what have you, you’re using lagging indicators to determine, in retrospect, who attended, what was produced, or how it was received by attendees.
Lagging indicators are best used in conjunction with leading indicators to determine trends and if outcomes were met. This can be made simple with the right technology infrastructure that compares leading and lagging indicators, offering insight.
Benefits of lagging indicators
- A clear indicator of success: In many cases, the metric that best assesses the impact of your efforts is going to be a lagging indicator because it takes time for your changes to take effect.
Weaknesses of lagging indicators
- They take time to measure: By definition, lagging indicators measure long-term trends, so they take weeks or months (or even longer) to change.
- You can’t see why: Lagging indicators show an outcome, but it can be unclear what variables impacted that outcome. You may know that your churn rate is high—your lagging indicator—but you don’t know which of the actions you took as a company impacted that rate.
- Difficult to change: Because lagging indicators are often high-level metrics like revenue, impacted by a lot of different departments within the company, small projects may not make a measurable impact. It can sometimes be difficult to tell whether minor changes in the metric are because of your actions or if they are just chance.
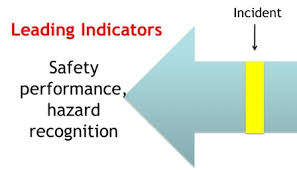
Leading indicator:
‘Metrics that provide information on the current situation that may affect future performance.
These indicators are easier to influence but hard(er) to measure. I say harder because you have to put processes and tools in place in order to measure them. When you start building product, a lot of what you will understand and build will emerge over time. You don’t know exactly what the level of effort is, until you finish. And if you are like me, given shifting priorities and dependencies, your lagging indicator is a moving target. If you use leading indicators, you can see if you’re tracking in the right direction. You can use the leading indicators to make changes to your behavior or environment while there is still time.
 Leading indicators give early indications of performance. These indicators “lead” to results by showing the progress you’re making toward your goal. Typically, leading indicators are metrics that will help keep you on track so that you hit your strategic objectives.
Leading indicators, which are particularly relevant from a management perspective, may be used to influence safety management priorities and the determination of actions for safety improvement. You may use this type of indicator to proactively develop (‘drive’) your company’s safety management capabilities, in particular during initial implementation of SMS. This may entail the setting of performance targets
.
Example: The percentage of changes to Standard Operating Procedures that have been subject to hazard identification and safety risk management
Safety performance measurement should ideally consider a combination of leading and lagging indicators. The main focus should be to measure and to act upon the presence of those systemic and operational attributes that enable effective safety management within your company and meanwhile, use lagging indicators to ensure that this safety management is effective. Lagging indicators, particularly indicators for lower level system failures, are useful to validate the effectiveness of specific safety actions and risk barriers or to support the analysis of information derived from your leading indicators.
Leading indicators can:
- reveal areas of weakness in advance of adverse events
- be associated with proactive activities that identify hazards
- aid risk assessment and management
- complement the use of lagging indicators by compensating for their shortcomings
For leading indicators to play an effective role in the improvement process, there must be an association between the inputs that the leading indicators are measuring and the desired lagging output, and leading indicators should indicate the direction of future lagging results. Examples of metrics that could be leading indicators are: the size of the safety budget,
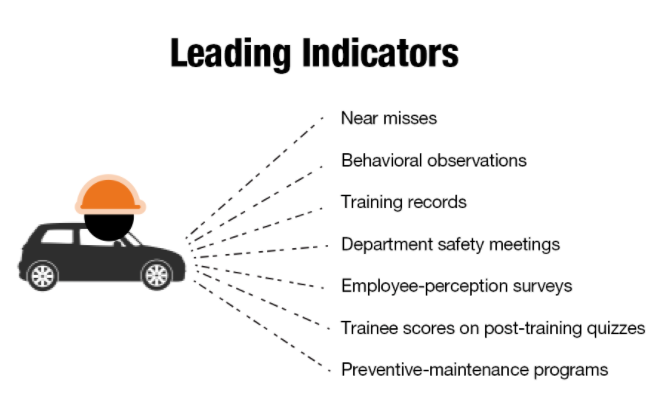
What are some examples of leading indicators?
The root causes of near misses, the percent of inspections or behavior based safety observations completed at a location, and training attendance and pass rates are all examples of leading indicators. By analyzing these metrics, you can get an idea of what is working, and what might be in danger of causing an incident.
Characteristics of Effective Leading Indicators:
Good leading indicators are based on SMART principles, meaning they are Specific, Measurable, Accountable, Reasonable, and Timely:
Specific: Does your leading indicator provide specifics for the action that you will take to minimize risk from a hazard or improve a program area?
Measurable: Is your leading indicator presented as a number, rate, or percentage that allows you to track and evaluate clear trends over time?
Accountable: Does your leading indicator track an item that is relevant to your goal?
Reasonable: Can you reasonably achieve the goal that you set for your leading indicator?
Timely: Are you tracking your leading indicator regularly enough to spot meaningful trends from your data within your desired timeframe?
How to use leading indicators
Leading indicators are trickier to measure than lagging indicators. That’s because they tend to be more abstract.
As mentioned, a leading indicator is a measure of where your business is going. For instance, if you stick to lagging measurements, like revenue, you may completely miss an important, but relatively small, segment of your market that is purchasing from another geographical location in which you don’t have a presence.
That’s where leading indicators enter the scene. By creating measurements like tracking individual purchases outside of certain zip codes or regions, you can learn where your company could potentially establish a new foothold.
Benefits of using leading indicators
- Faster feedback: By tracking leading indicators, your team can get feedback on their efforts more quickly and determine what actions they might need to take to achieve their over-arching objectives.
- Team involvement: Because there are often many facets to broad goals, there are typically many leading indicators to track. Different team members and departments can own different metrics, so everyone contributes to meeting the company’s larger objectives.
Weaknesses of leading indicators
- Just a proxy: If you’re using a leading indicator as a proxy for a lagging indicator, keep in mind that while the leading metric should affect the lagging indicator, it might not have the impact you expect. It’s important to track both so you can monitor ongoing progress as well as the actual outcome of your changes.
Leading vs. lagging indicators—work together instead of apart
A lagging indicator may be the best metric for measuring the outcome of your effort, but tracking lagging metrics alone is problematic. It takes a long time to see results, and lagging indicators can’t help you make ongoing adjustments.
The solution is to use a combination of leading and lagging indicators. Look at leading indicators on an ongoing basis to make changes that will help improve your odds of success.
Use leading indicators that complement your lagging indicators and help you measure progress more quickly. Below are two examples of leading and lagging indicators that pair well together in different scenarios.
Track your leading vs. lagging indicators at different intervals
 While it’s essential to monitor both leading and lagging indicators on a regular basis, you don’t need to track them at the same rate. Lagging indicators take a long time to change, so there’s no reason to track them on a daily or sometimes even weekly basis. Instead, check them less frequently, perhaps monthly or quarterly, depending on the metric.
Leading indicators, on the other hand, change more rapidly and should be checked often. Consider adding them to a dashboard so you can track them in real time on a daily or weekly basis. Display the dashboard in your office or share email to keep your leading indicators top-of-mind for your team.
Start tracking the right safety metrics for your organization:
When you're ready to target and monitor your safety indicators, we've put together the following checklist to help you get started.
- Identify the top problem areas of your safety program. Start with the hazards that have the greatest risk of harming workers. These should be severe hazards with the greatest likeliness of occurrence. If you're just getting started with hazard assessments, we've got a helpful article on how to evaluate them using a risk matrix. Worth a read! Example: After reviewing last year's injury records, you noticed that 22 workers were injured from trips and falls in the past year. Due to the frequency of injuries caused by tripping hazards, you decide this might be a good hazard to start with.
- Set a goal. Make an informed decision on what your goal should be and how long it might take to achieve. Example: After discussing it with your workers, you learned that most of the trips and falls were caused by floors cluttered with tools and equipment. You decide that a good first step to address this hazard might be to inspect and clear assembly line floors daily. You believe that if these inspections are conducted on schedule, you could reduce incidents resulting from slips, trips, and falls by 90% this quarter.
Choose your leading and lagging indicators to track. Choose metrics that can help you to achieve your goal over time. Example: The number of trips and falls is a lagging indicator that you hope to drive down with a leading indicator, such as the number of inspections completed on schedule.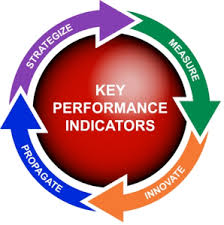
- Start gathering data. Begin collecting the leading indicator data for the time period you decided on as well as the data for your goal during that same time period. Example: Every week, review your checklists to make sure you have inspected all daily items. If inspections are being missed on any given day, find out why and try to address the issue.
- Periodically assess (and adjust!) your indicators and goals over time.
Assemble the results into a graph to determine whether there is a positive relationship between your leading indicator and your goal. Communicate your progress with workers. Did the actions that you took help you to achieve your goal? If not, think about how you can get on track. OSHA recommends that you customize the type and number of indicators to your needs, resources, and abilities as they evolve over time. Example: If you've achieved your goal, you can decide whether to continue tracking the daily cleanups after they have become routine (or consider decreasing the tracking frequency from daily to weekly). Then begin to develop and track a leading indicator for a different hazard.
Characteristics of good indicators:
For any performance indicator to be effective, it is important that it is:
a) Objective and easy to measure and collect,
b) Relevant to the organization or workgroup whose performance is being measured,
c) Providing immediate and reliable indications of the level of performance,
d) Cost efficient in terms of the equipment, personnel and additional technology required to gather the information,
e) Understood and owned by the workgroup whose performance is being measured.
In addition to these general requirements, the examples used in the introduction demonstrate some additional characteristics that leading performance indicators must have if they are to be useful:
- There must be a connection between the leading information and the outcomes that are of interest.
- The reasons behind the indicators and their benefit must be understood by line management and the workforce affected.
- The indicators must provide information that can guide future actions to either improve desired outcomes, or provide warning of potential weaknesses and allow action to avoid undesirable outcomes.
Importance of analysis:
Most management systems are complex with many inputs and many outputs. This is particularly true for health and safety where several inputs (or lack of inputs) may contribute to the final outcomes. The effectiveness of leading performance indicators can be improved by better
understanding the contribution that different inputs make to the desired output performance. When using leading performance indicators, it is important to periodically analyze the relationships between the leading and lagging indicators that are being used.
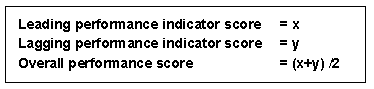
Statistical analysis should be used to verify /identify the cause and effect links between inputs that are monitored, the performance standards that are set, and outcomes that result. This should be done before any of the performance indicators are combined together to produce an index that
might be used to indicate the overall performance. Such combination may be desirable and useful to simplify communication of overall performance. However, if such combination is to be meaningful, the way in which the leading performance indicators are combined, and the weighting that is given to individual indicators needs to be based on a sound understanding of the effect of the different inputs.
Presentation of Leading Performance Indicators:
Emphasized the importance of analyzing information from leading and lagging indicators to confirm / identify cause and effect relationships. However, once this is done, the number of different indicators that are monitored can make it difficult to communicate effectively whether the overall performance is better or worse. To overcome this, the separate indicators are sometimes combined together to produce an overall performance index. However, this practice is open to the criticism that good results from leading performance indicator are simply being used to cancel out poor lagging performance, e.g.
An alternative form of presentation is to keep the leading and lagging indicators separate and plot them against each other as shown in figure A. This form of presentation helps to visually confirm the connection between the leading indicators and the lagging outputs, and to demonstrate that the leading performance indicators are being used effectively.
Once plotted, the results can be interpreted as follows:
1. Results plotted in quadrant 1 represent poor performance on inputs (leading indicators) and poor
performance on outputs (lagging indicators): serious attention is required in all areas to improve performance.
2. Quadrant 2 represents poor input performance but good output performance. As there is always an element of luck as to whether inadequately controlled hazards actually result in harm, performance in this quadrant represents an organization that has been lucky. However, one can not rely on luck. Future performance may not be so good and more attention to input is required to maintain the performance.
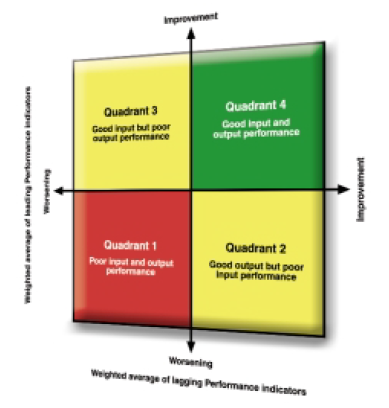
Figure A
3. Performance in quadrant 3 represents good input performance that is not resulting in good output performance. Possible reasons for this are:
- There is a time delay between making improved inputs and the benefits being seen in the lagging output performance, and insufficient time has lapsed for the improved inputs to have their effect,
- Inappropriate inputs are being measured or the targets being set are too low,
- The organization is going ‘through the motions’. Actions are being taken to achieve a good score in a way that does not achieve actual benefits; e.g. generating safety observation cards to make up numbers without attention to quality or following up with adequate corrective action to improve safety. Organizations in this quadrant need to review the inputs that they are making and the leading performance indicators that they are using to measure input performance.
4. Performance in quadrant 4 represents good input performance and good output results. The organization is achieving good performance now and has reassurance that they are making the necessary efforts to sustain and further improve their performance. This method of presentation avoids the criticism of good leading performance indicator results being simply used to cancel out poor lagging performance indicators. An organization can not set easy input targets to balance poor
output performance as a high leading indicator score without a corresponding improvement in output performance simply moves the organization from quadrant 1 to quadrant 3.
Incentive and recognition schemes Many companies have used awards, incentives and recognition schemes to encourage improved performance. Incentive schemes that are based on the inputs and efforts that are being made to improve performance are more likely to have the desired effect than schemes that rely on output measures that are not under the direct control of the
workgroup. Leading performance indicators are ideally suited for use in incentive schemes. The process for identifying suitable indicators helps to increase workforce engagement and develops ownership of the scheme. Using leading performance indicators will help to ensure that improved
motivation is focused on the activities that are considered to be most important. Their use can also help to improve the perceived ‘fairness’ of the scheme by increasing the ‘transparency’ of the linkage between the actions that participants take and the recognition that they receive.
Some elements for success of an incentive and recognition system include:
- Actions required to achieve recognition should be specified and perceived as achievable.
- Requirements should be perceived as being relevant to improving performance by participants; this will generally preclude a ‘one size fits all’ solution.
- Awards should not recognize one group at the expense of another.
- Recognition / reward should be available to everybody who achieves the criteria.
- Progress towards achieving awards should be monitored and reported to all participants.
- Groups should not be penalized for failure by an individual.
Click the below link to download the safety performance power point presentation

Safety performance measuring -Power point presentation
Guideline for leading indicators